Milestone chart: why your project needs one

Hannah

Milestone charts turn project chaos into efficient success stories. A milestone schedule brings instant clarity to your projects. Your team gets closer to the finish line with each milestone they hit, and that creates a real sense of achievement. On top of that, tracking milestones boosts team communication and makes everyone more accountable while letting you plan better. Most milestone Gantt charts show every task and how long they take. But a milestone chart focuses only on the key project steps that matter most.
In this piece, you'll discover the ground benefits of milestone charts through practical examples. Want to reshape your project planning? Create your own milestone chart template with Xmind.
Why milestones matter in project success
Project milestones are the backbone of successful project management. They mark specific points on a project's timeline that show completed activities or new phase beginnings. These aren't just tasks but crucial checkpoints that reshape how teams work together and reach their goals.
Milestones as progress checkpoints
Project milestones work as powerful markers that show your project plan's forward movement. Unlike regular tasks, these milestones point out the most important moments in your project's trip and help you see if you're on track. They act as control stations that give your stakeholders a chance to check performance and keep the project moving the right way.
Milestone tracking helps you zero in on critical work and share progress confidently with people who don't need detailed updates. This big-picture view quickly shows completed phases and your distance from the goal. You can also dig deeper into details when needed to spot roadblocks or celebrate wins.
How they align teams and timelines
A milestone chart's greatest strength lies in its power to boost communication through clear markers for teams. This open view makes shared workspace where everyone knows their targets. Yes, it is true that milestone schedules show logical connections between project phases, which makes communication between the organization and project team quick and clear.
Project development becomes easier to monitor with milestone charts. Managers can spot potential problems early and fix them. The core team can then distribute resources more quickly, which prevents bottlenecks and keeps the project flowing smoothly. Well-planned milestones help teams work together by making objectives and action steps crystal clear.
Impact on motivation and clarity
The psychological effect of milestone tracking often goes unnoticed. Each achieved milestone represents a win, even small ones, that lifts team spirit and increases involvement. These successful moments deserve celebration—through simple recognition or team gatherings—as they promote positive relationships and build trust.
Milestones create a feeling of achievement that keeps momentum going throughout the project's life. They connect daily tasks to bigger goals by highlighting key value-creating events. This prevents teams from getting stuck in routine work during longer projects.
Projects without clear milestone charts tend to drift aimlessly. Teams lose focus and progress slows down. A well-laid-out milestone system provides the direction and motivation needed to keep everyone moving forward purposefully.
From goals to milestones: building your project timeline
Project timelines turn abstract goals into clear checkpoints. A milestone chart becomes straightforward when you know the process. You just need to break down objectives into measurable achievements that lead your team to success.
Start with defining project goals
Your project needs clear objectives that point the way forward and help spot significant milestones. The SMART criteria works best here—make goals Specific, Measurable, Achievable, Relevant, and Time-bound. The core team should brainstorm to gather different views. Document these goals clearly and check them throughout the project to stay on track as things change.
Break down phases and deliverables
After setting goals, split your project into manageable pieces. Large initiatives need distinct phases like planning, execution, testing, and closure. Each phase should have specific deliverables that show progress. This creates natural spots to place milestones and keeps your team focused on producing real results.
Identify true milestones vs. tasks
The difference between milestones and tasks matters a lot when planning. A milestone marks a significant achievement in your project—a moment that shows important progress. Tasks are the work to be done—they have specific durations, owners, and deadlines.
A software project shows this well. "Code development complete" stands as a milestone, while "Write authentication module" counts as a task. Note that milestones should not exceed the number of tasks. Too many milestones usually mean you've labeled regular activities as major achievements.
Create a milestone schedule
Set specific dates for each milestone. Think about dependencies and give enough time for project phases. Get realistic timeframes by asking team members and looking at similar past projects. Add some buffer time for unexpected challenges. Review your schedule often.
Want to make your first professional milestone chart? Xmind offers accessible templates that make milestone tracking visual and simple.
How to use Xmind for milestone planning
Xmind is a powerful visual tool that turns complex milestone planning into something you can easily manage. Its user-friendly design and special features help you create professional milestone charts that boost project visibility and line up team goals. Want to make milestone tracking easier? Try Xmind today.
Overview of Xmind features for project planning
Xmind turns project planning into a clear, visual workflow. You keep one source of truth and simply switch how it’s shown—think in a mind map, review in a table, present on a timeline—while AI helps you draft faster and built-in status, notes, and comments keep everyone aligned from kickoff to sign-off.
Plan visually, switch views instantly: Use Format → Style → Structure to flip the same content between Mind Map, Tree Table, Timeline, and Matrix (great for KPI grids).
Start fast with AI: Create with AI converts a short brief into an editable outline (goals, scope, risks, deliverables) you can refine on the canvas.
Make status scannable: Add Markers and Progress (0–100%) to topics; store assumptions and decisions in Notes so context lives on the node.
Collaborate in place: Use Comments to collect feedback and @mention reviewers, keeping discussion tied to the exact clause.
Present straight from the plan: Run updates in Pitch Mode, then export to PDF/Image or share the live map link.
Stay consistent and on-brand: Tweak shapes, fills, borders, and typography in the Style panel and save custom themes for team-wide reuse.
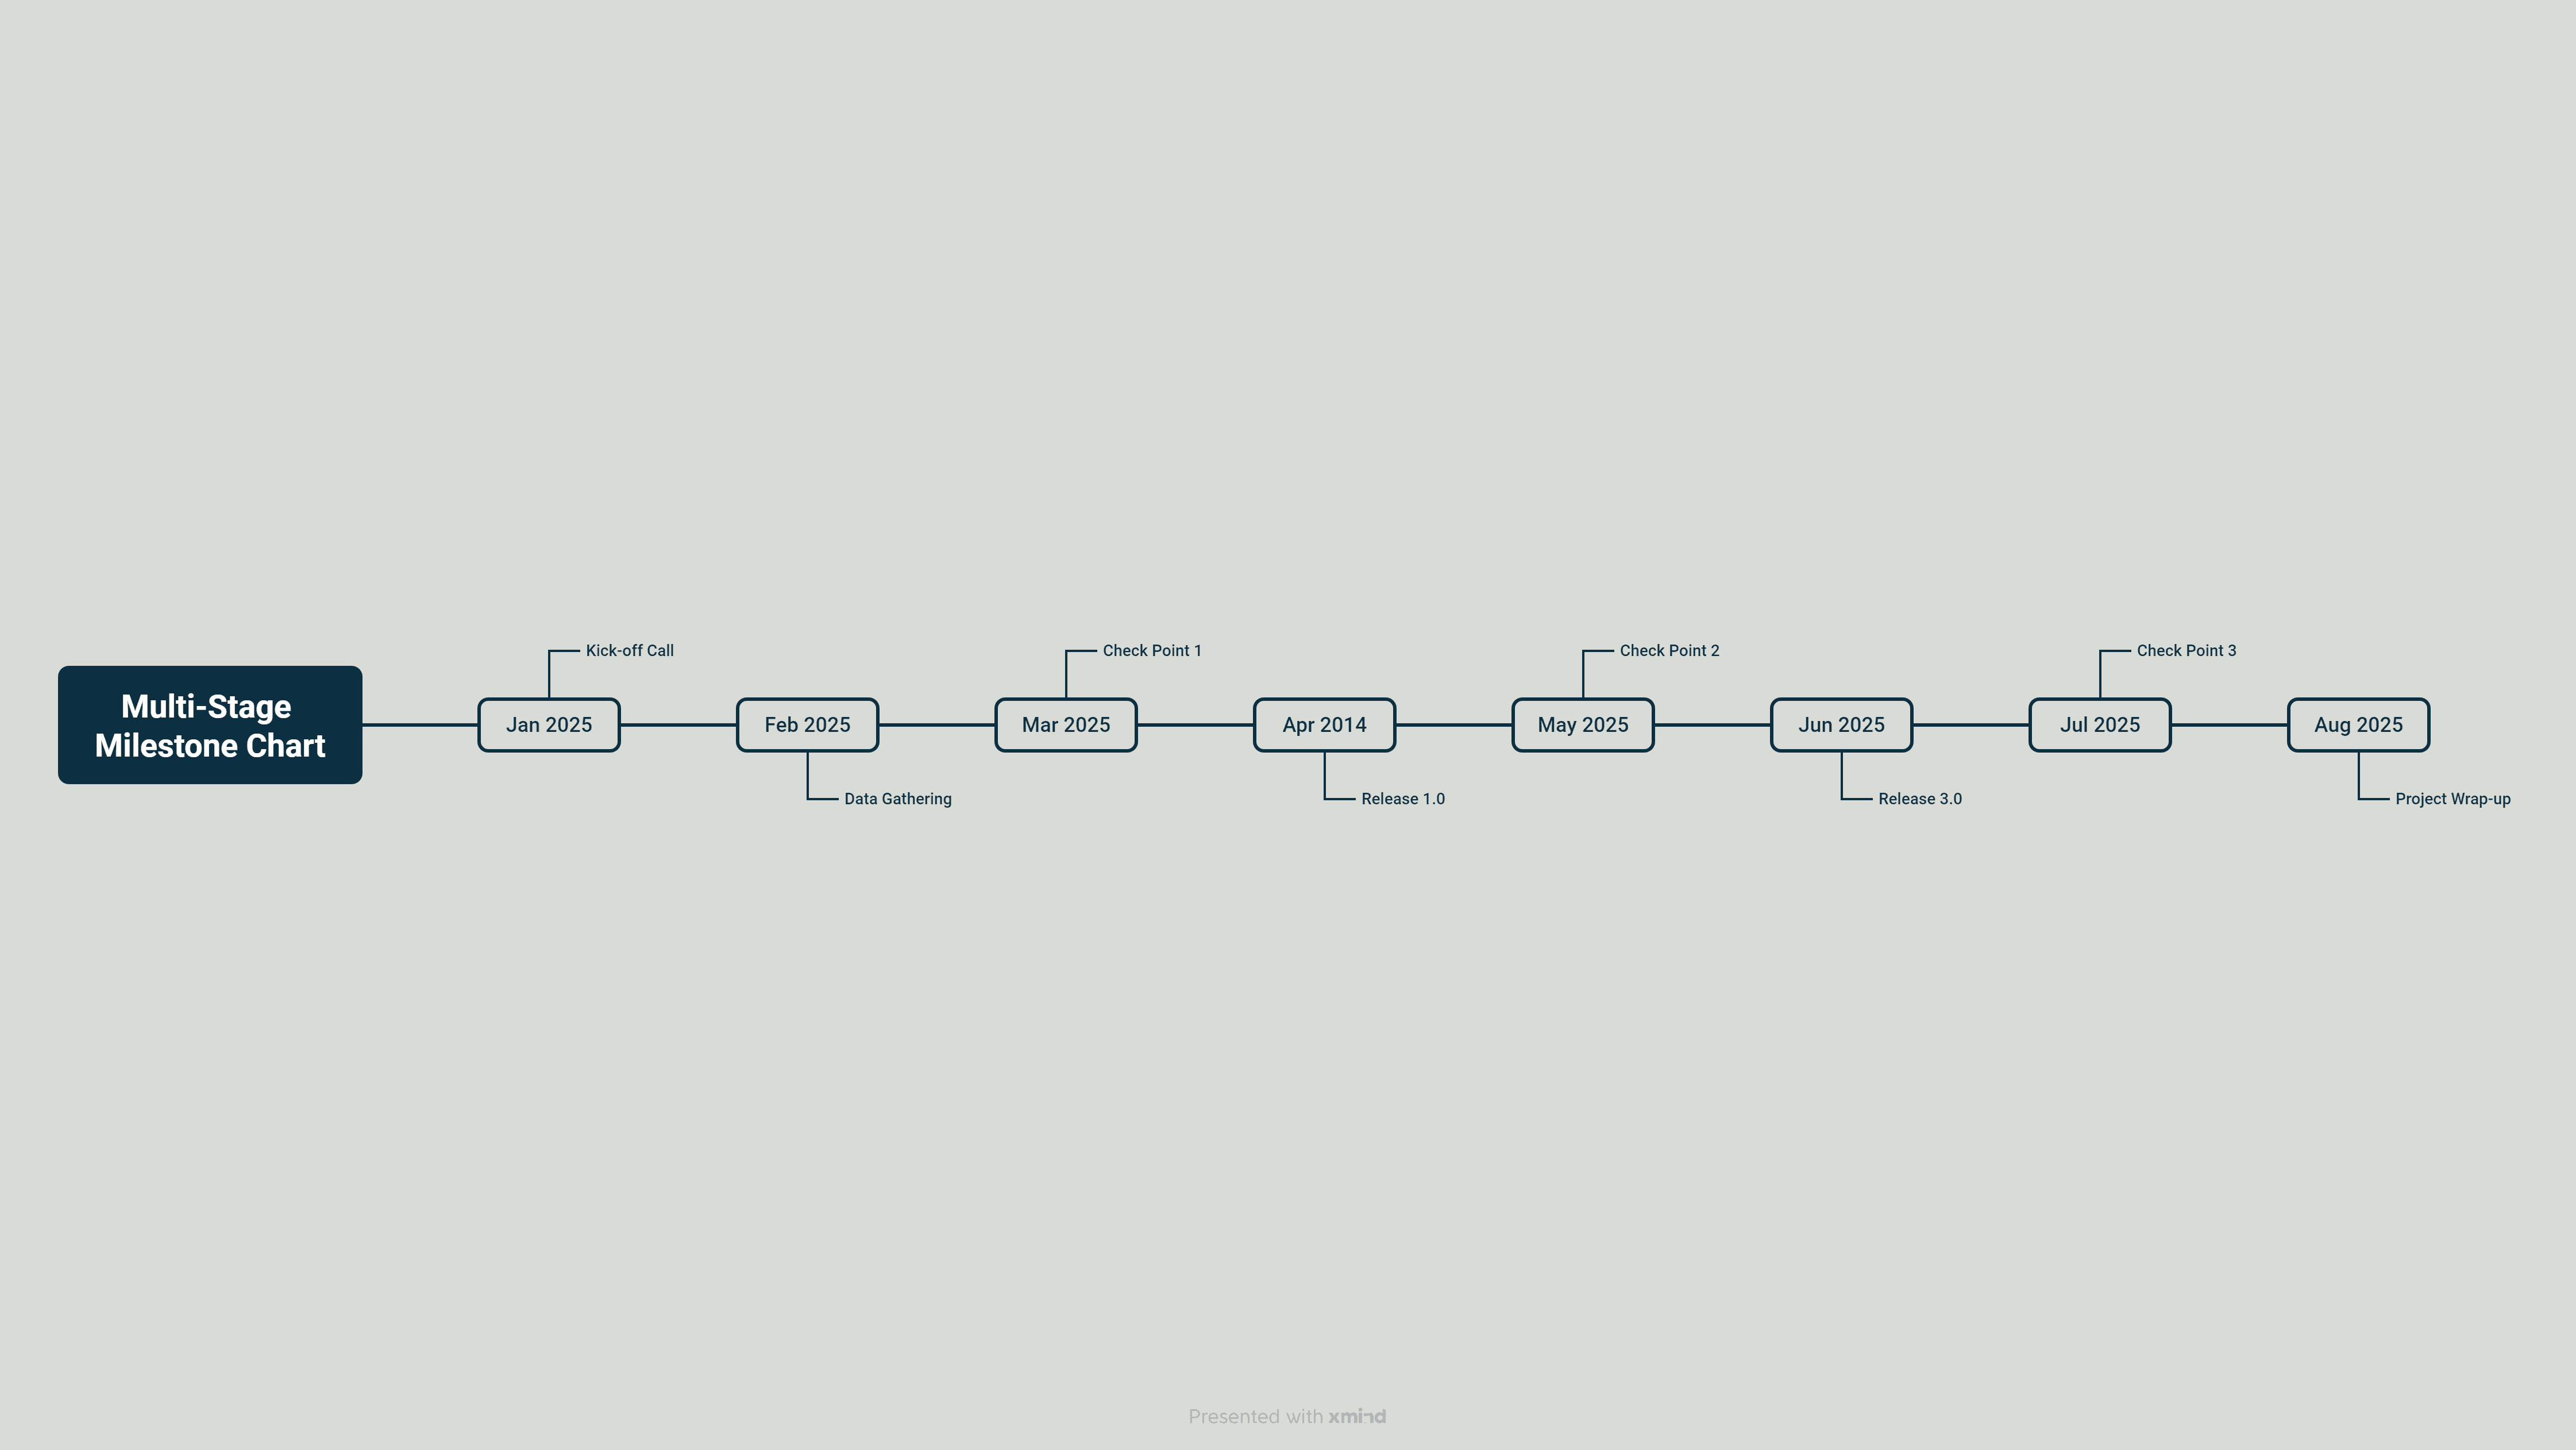
Creating a milestone chart template in Xmind
You can set up a milestone chart in Xmind with these simple steps:
Step 1. pick the structure
Select the topic that will hold your timeline (or the whole map) and switch to Format → Style → Structure → Timeline.
Step 2. add the milestones
Type each checkpoint (e.g., “Design approved”, “Beta launch”) as a topic on the line. Drag to reorder; add subtopics for phase summaries or interim reviews.
Step 3. make it readable at a glance
Use the Style panel to set colors, shapes, and borders; save as a Custom Theme so kickoff/review/release markers look consistent. Add Markers/Stickers for status and Notes for details without cluttering the timeline.
Step 4. collaborate and present
Keep feedback in context with Comments (use @mentions). For updates, switch to Pitch Mode so sections of the timeline render as clean slides, then export to PDF/Image or share the live map.
Linking tasks and dependencies visually
Xmind makes handoffs and sequencing unmistakable. Draw Relationship lines between related topics, add a short label, and keep context on the nodes with Notes or Comments so owners know what they’re waiting on. Placing these links alongside a Timeline view gives stakeholders a clean read on where work converges—design to development, vendor delivery before integration, legal review ahead of launch—and spotlights the checkpoints where a slip will ripple through the plan.
To keep complex work readable, group clusters with Boundaries, and use Markers or color accents on the connections to signal urgency, external dependencies, or items on the risk radar. For cross-team programs, link milestones across separate branches so you can tell, at a glance, which teams block others and where parallel tracks safely diverge. During reviews, collapse lower-level tasks and keep only the critical handoffs visible; in Pitch Mode, those links become an executive-friendly storyline that explains “what depends on what” without drowning people in task bars. This way, your map doubles as both a coordination tool for day-to-day work and a clear narrative for decision makers.
Collaborating with teams using Xmind
Xmind makes it easy for teams to work together across Windows, macOS, iOS/Android, and the web app (great for Chromebooks). You can share a map by link with view or edit permission, so stakeholders open the latest version in a browser or the desktop app—no exports back-and-forth.
Comments and @mentions. Add a comment on a specific milestone or topic, @mention teammates to notify them, and keep the discussion attached to the exact item you’re reviewing. Threads stay with the map, so decisions don’t get lost in chat apps.
Cloud sync with version history. Maps saved to your Xmind account sync across devices; you can open Version History to view and restore earlier saves if something goes off course.
Clear ownership without clutter. Use Notes to capture decisions or meeting minutes on the node, and apply Markers (priority, status) so reviewers can scan progress quickly.
Always available. Cloud-saved maps open from any device; if you work offline, edits sync automatically when you’re back online.
This workflow keeps milestone charts living in one place—discussed where the work lives, safely versioned, and accessible to everyone who needs it.
Real examples of milestone chart project management
Ground milestone charts show practical applications in a variety of industries. Here are three concrete examples you can adapt.
Example 1: Software launch project
Milestone tracking creates structure within complex software development projects. A tech company's milestone charts typically have these critical checkpoints:
Feature List Approved: Product scope finalization prevents scope creep and arranges stakeholder expectations
UI/UX Finalized: Interface design completion before coding speeds up development
Beta Version Released: Testable software delivery to select users generates ground feedback
Final Deployment: Development work culminates in product readiness for end-users
These strategic milestones help development teams maintain schedules, tackle critical tasks promptly, and deliver products on time and within budget.
Example 2: Company merger communication plan
Meticulous milestone scheduling leads to successful mergers. McKinsey research points to six significant communication milestones that determine merger success.
The process starts with stakeholder identification (investors, customers, vendors, regulatory bodies). Trigger events like Day 1 and leadership appointments follow next. The team then builds governance structures for communications. Core messaging explains the merger rationale clearly. Detailed communication plans emerge for each milestone. Two-way feedback channels monitor reception effectively.
Example 3: Marketing campaign rollout
Sequential phase milestone charts benefit marketing campaigns significantly:
Campaign brief completion starts the planning phase by establishing scope, objectives and audience. Asset approval milestones guide content creation. Systems readiness checks mark pre-launch preparation. Marketing efforts move from planning to action during the launch phase. Performance metrics track progress across channels. ROI and conversion rate analysis reveals campaign success.
Conclusion
Milestone charts without doubt transform project management from a chaotic process into a structured experience toward success. Visual milestone tracking provides essential checkpoints that arrange teams and maintain motivation during complex projects. Your team deserves this clarity and purpose instead of dealing with undefined objectives.
Milestones do more than mark progress—they become celebration points that energize your team and show tangible progress to stakeholders. Projects often drift aimlessly when milestones are missing. Deadlines slip and team morale takes a hit.
Want to revolutionize your project planning? Try Xmind today to see how visual milestone charts can streamline your workflow. The difference between project failure and success lies in your ability to see the path forward.
FAQs
Q1. What is the difference between a Gantt chart and a milestone chart?
A Gantt chart maps the work itself—tasks laid out on a timeline with start and end dates, durations, owners, and often dependencies—so you can plan sequencing, spot overlaps and critical path, and track progress day to day. A milestone chart strips away task bars and shows only zero-duration checkpoints (e.g., approvals, phase gates, launch dates), giving stakeholders a big-picture view of the key outcomes and decision points. In practice, use the Gantt for execution detail and the milestone chart for concise, executive-level status.
Q2. How do milestones contribute to project success?
Milestones act as crucial checkpoints in a project, marking significant achievements or phase completions. They help teams stay focused, provide a sense of accomplishment, and allow for timely adjustments to keep the project on track.
Q3. What's the difference between milestones and regular tasks?
Milestones are significant events with zero duration that mark important progress, while tasks are actual work items with specific durations and deadlines. For example, "Code development complete" is a milestone, whereas "Write authentication module" is a task.
Q4. What are the key advantages of using milestone charts in project management?
Milestone charts provide visual timelines of key project events, enhancing transparency and communication among team members. They help in tracking progress, aligning teams, and maintaining motivation throughout the project lifecycle.


