Xmind Fishbone Diagram: Mastering Root Cause Analysis

Crystal

The Fishbone Diagram, also known as the Ishikawa Diagram or Cause and Effect Diagram, is a powerful tool for root cause analysis and problem-solving. Created by Kaoru Ishikawa, this diagram helps teams visually map out potential causes of a problem to identify its root cause. Xmind, a popular mind mapping software, provides an efficient way to create and utilize Fishbone Diagrams. In this guide, we’ll explore the Fishbone Diagram, its benefits, types, and how to develop and use it effectively with Xmind.
What Is a Fishbone Diagram?
A Fishbone Diagram is a visual tool used to identify and analyze the root causes of a problem systematically. It resembles the skeleton of a fish, with the problem statement at the head and potential causes branching off from the spine like bones. This structure helps teams brainstorm and categorize causes, making it easier to pinpoint the root cause of the issue.
Components of a Fishbone Diagram
A Fishbone Diagram consists of three main components:
Head: The problem statement, clearly defined to focus the analysis.
Spine: The main problem or effect, forming the backbone of the diagram.
Bones: Categories of causes branching off from the spine. Categories of causes branching off from the spine. Common categories include People, Processes, Equipment, Materials, Environment, and Management.

Fishbone Diagram, Ishikawa Diagram, Cause and Effect Diagram, Root Cause Analysis, Problem-Solving Tools, Xmind Fishbone Diagram, Visual Problem-Solving, Types of Fishbone Diagrams, What is a Fishbone Diagram, Creating Fishbone Diagrams in Xmind, Fishbone Diagram Benefits
Benefits of Using Fishbone Diagrams
Fishbone Diagrams offer several significant benefits that enhance problem-solving and root-cause analysis.
Clarity in Identifying Root Causes: By visually mapping out potential causes, it’s easier to see how different factors contribute to the issue, ensuring no critical factors are overlooked.
Improved Problem-Solving Efficiency: By breaking down and categorizing potential causes, Fishbone Diagrams save time and resources by focusing on the most significant contributors.
Encouraging Comprehensive Analysis: Fishbone Diagrams prompt teams to consider a wide range of potential causes, ensuring a thorough investigation by dividing causes into categories like People, Processes, Equipment, Materials, Environment, and Management.
Simplifying Complex Problems: They help break down complex problems into manageable categories, making it easier to tackle issues systematically and efficiently.
When to Use Fishbone Diagrams
Complex problems with multiple potential causes: Ideal for breaking down and analyzing problems with multiple causes, ensuring thorough identification and resolution.
Situations requiring team collaboration and brainstorming: Facilitates effective team brainstorming by providing a visual structure that encourages input from all members.
Scenarios where visual representation aids in understanding and analysis: Enhances understanding and communication by clearly showing the relationships between causes and the main problem.

Types of Fishbone Diagrams
Different types of Fishbone Diagrams can be tailored to specific needs:
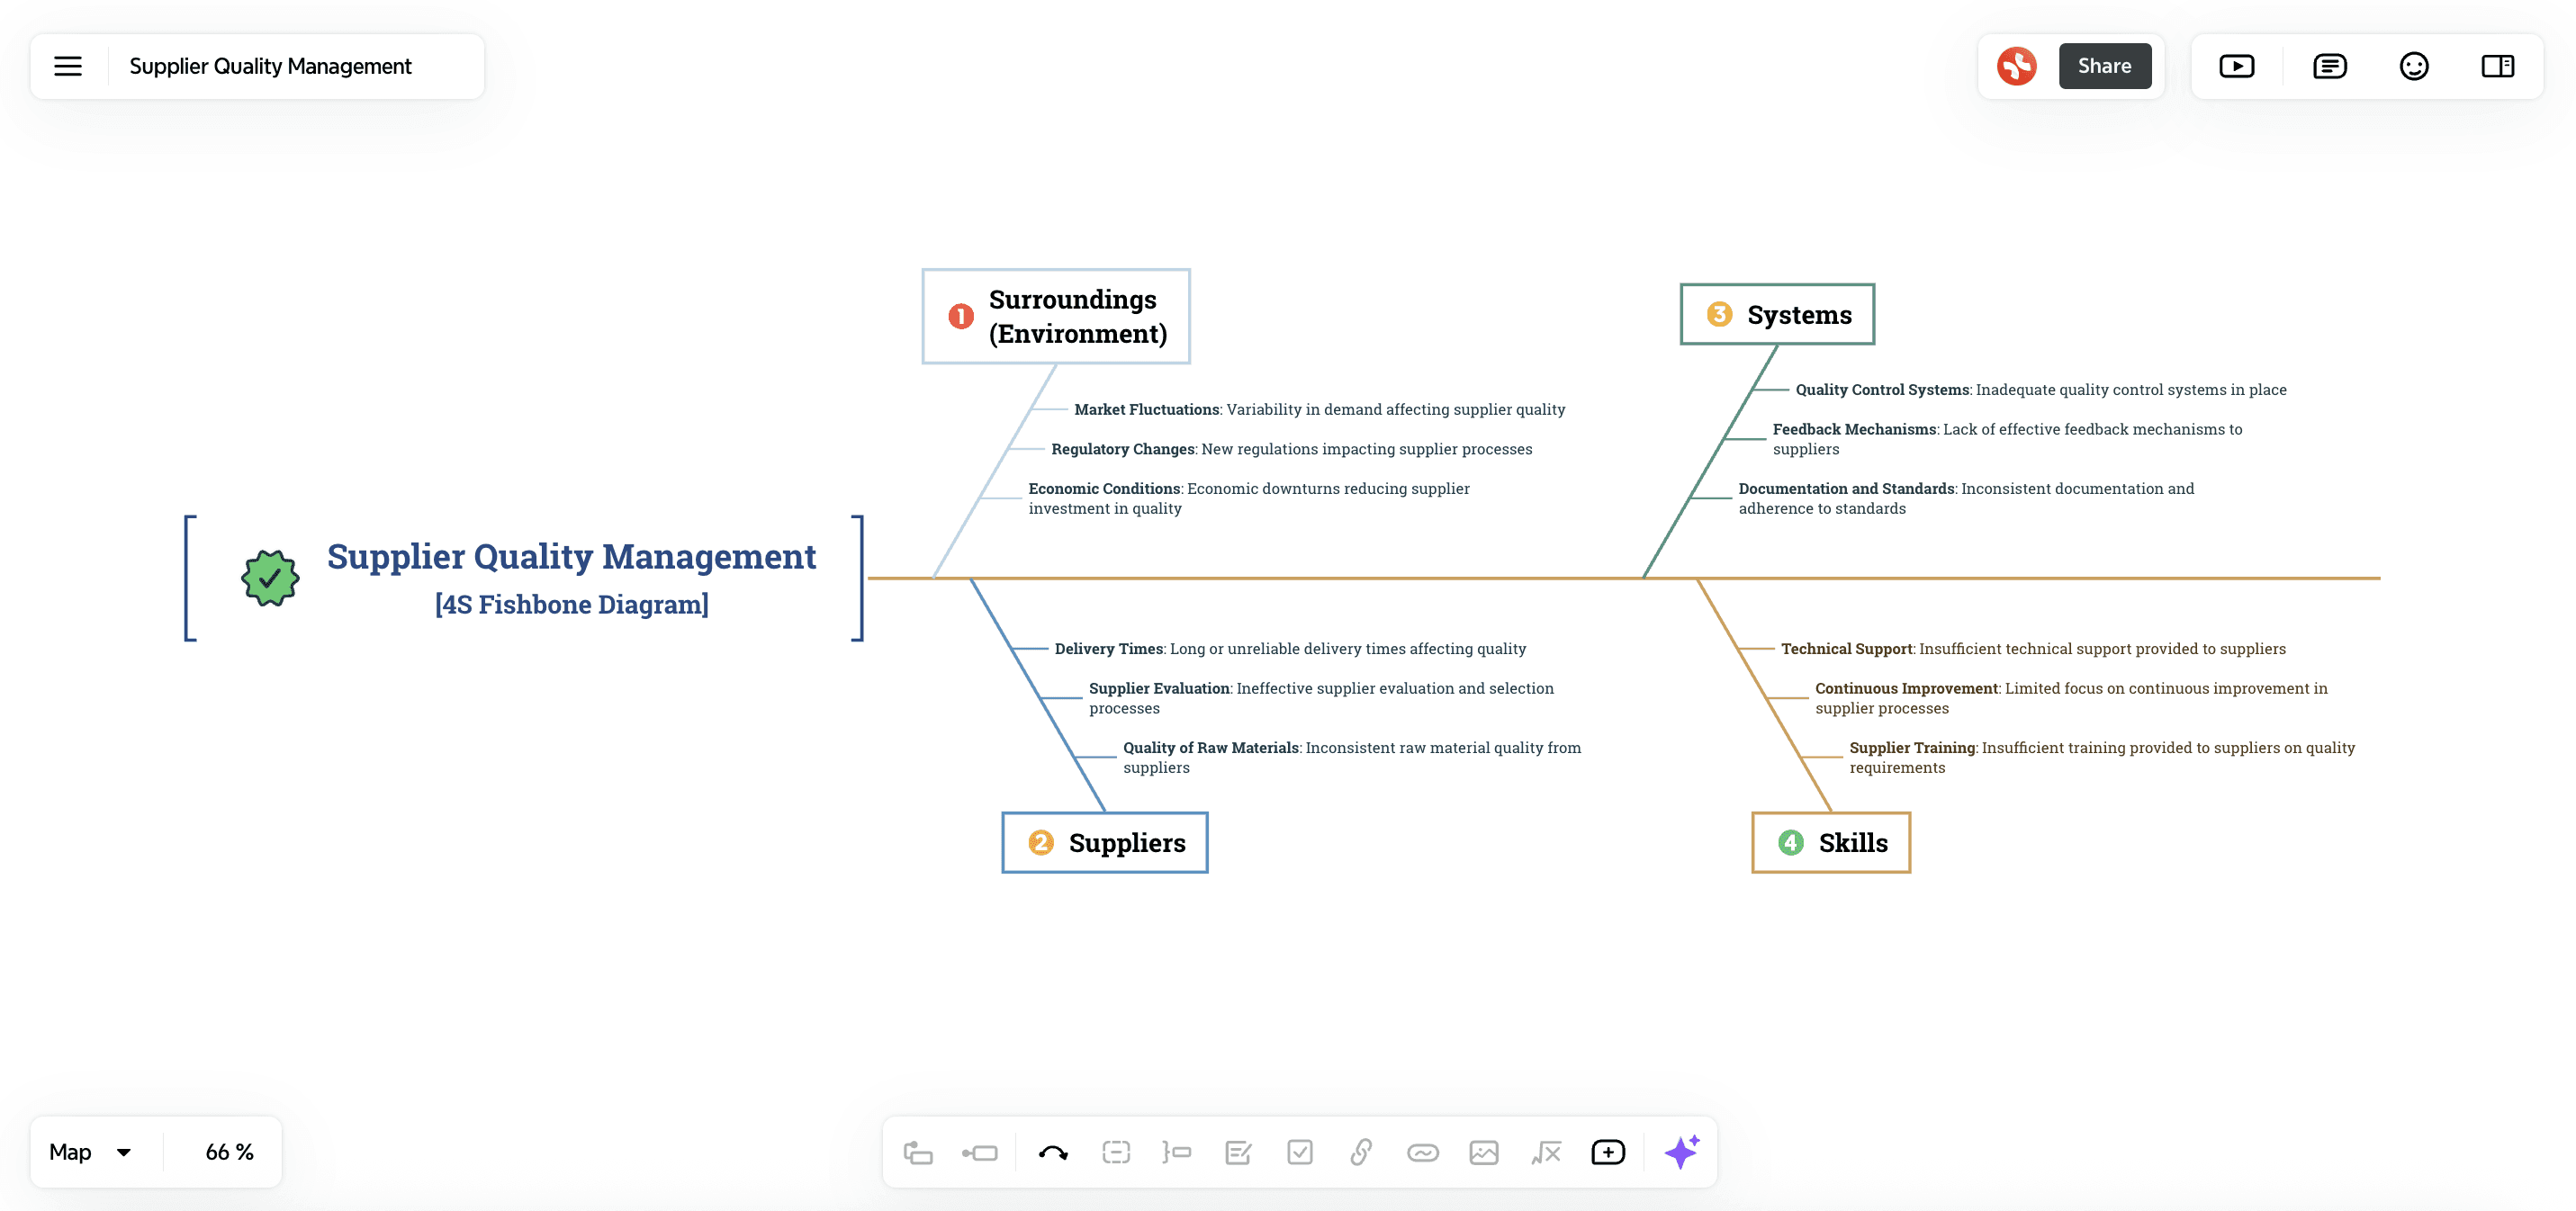
4S Fishbone Diagram
Focuses on Surroundings, Suppliers, Systems, and Skills. Best for quality management and better supplier management practices.
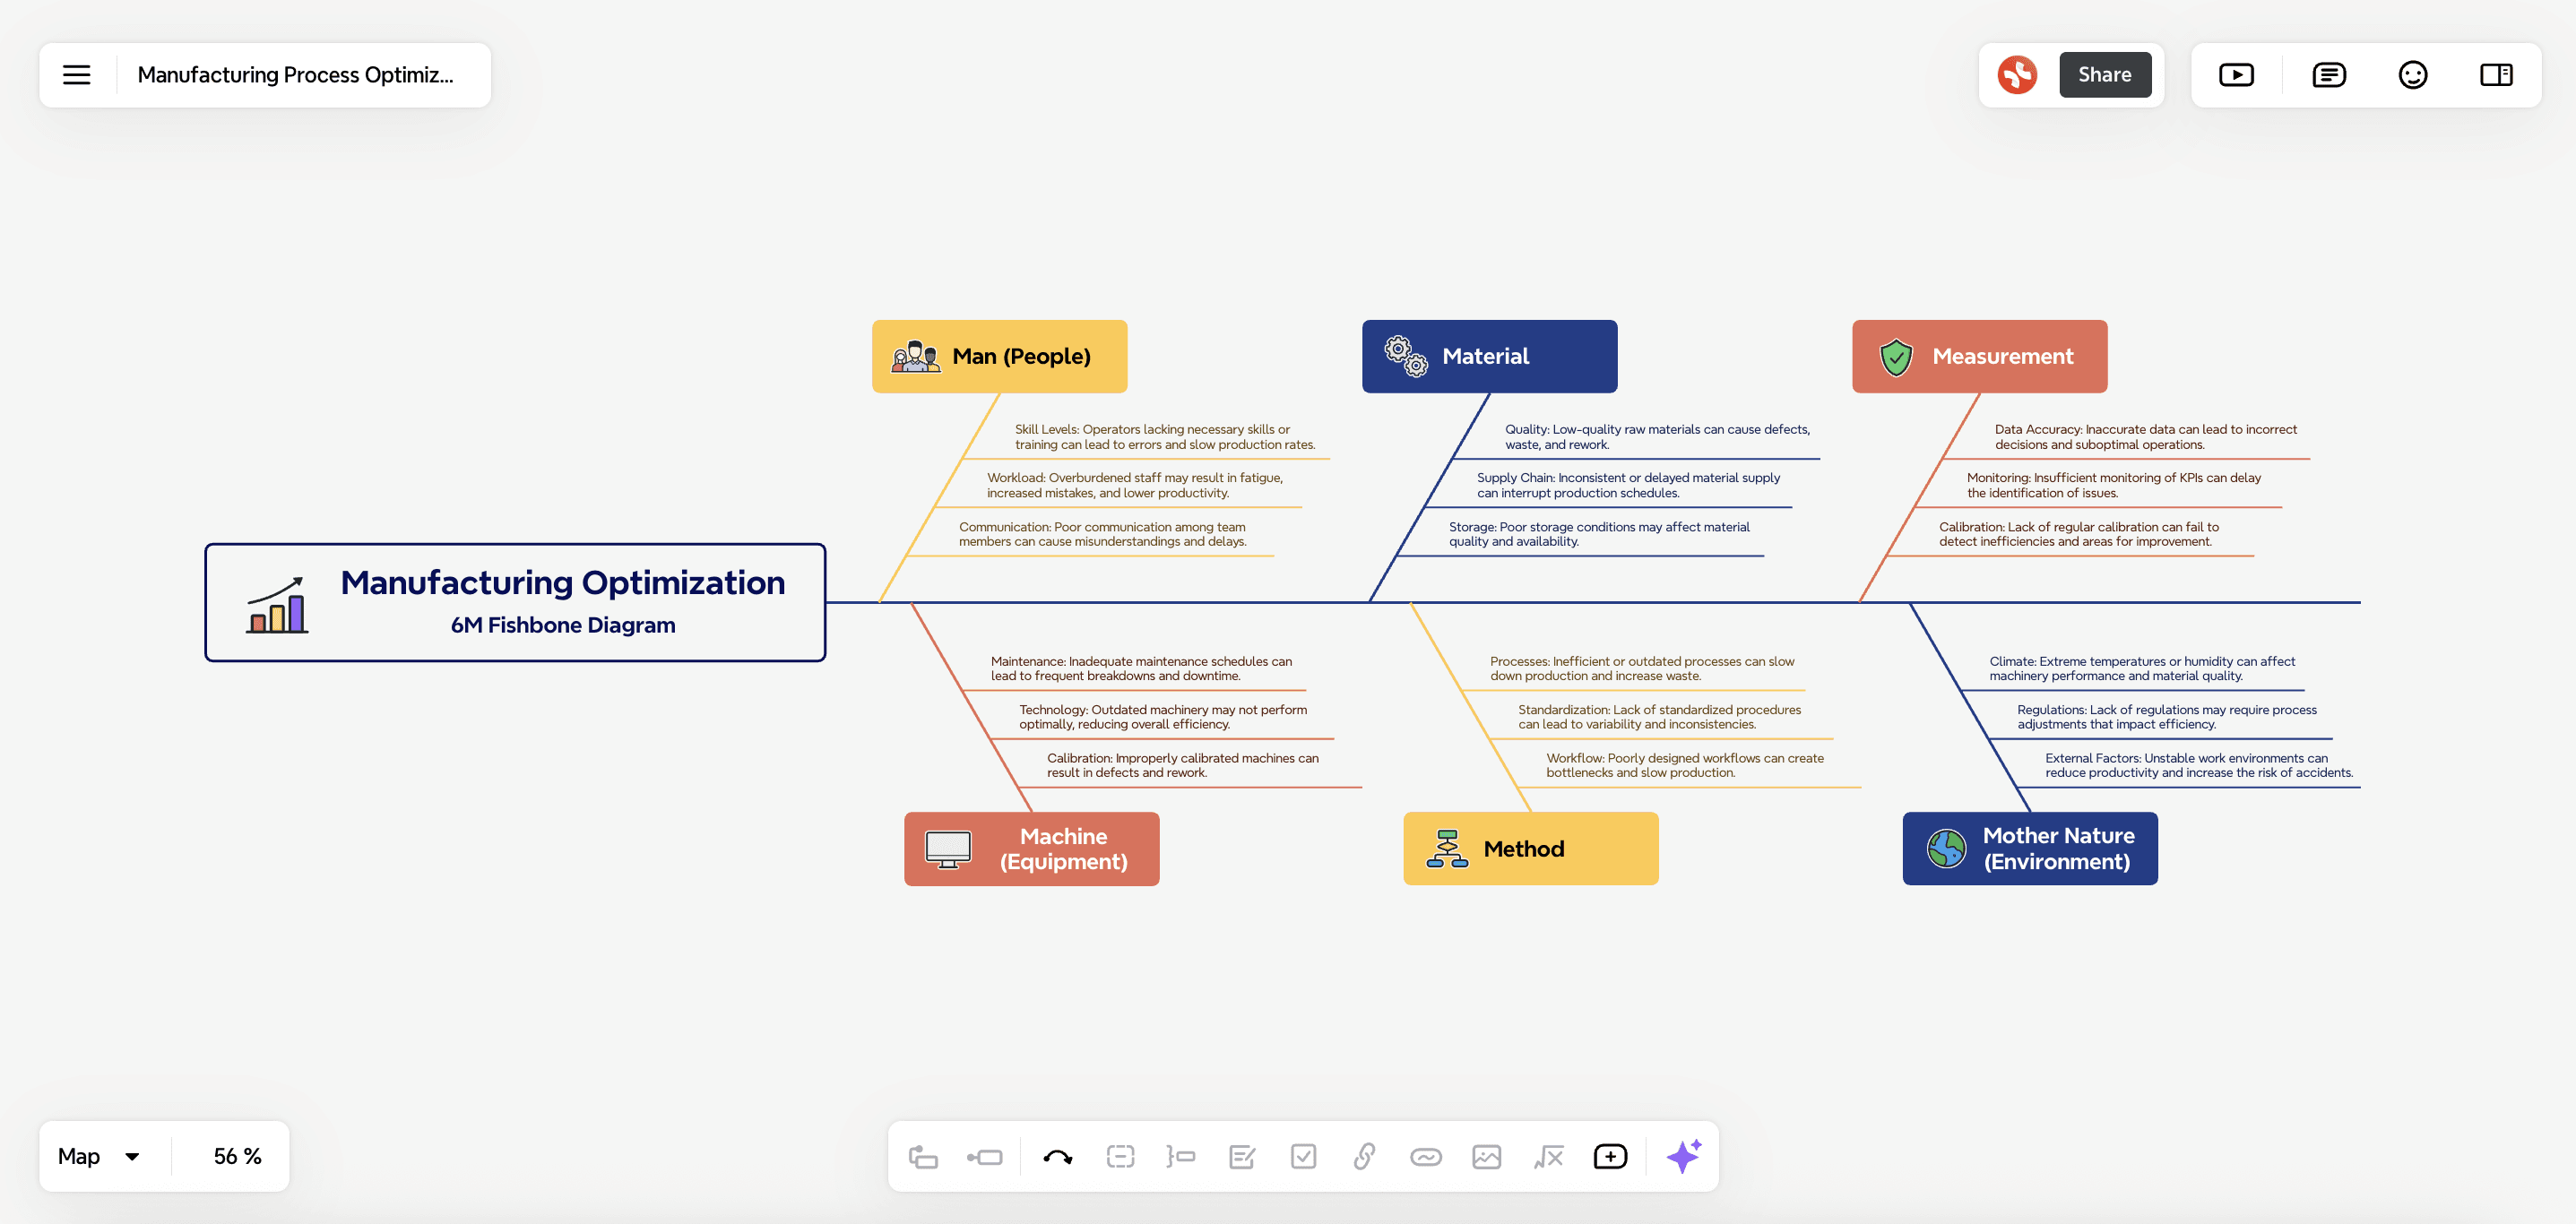
6M Fishbone Diagram
Includes Man, Machine, Material, Method, Measurement, and Environment. Ideal for manufacturing, healthcare, service industries, and project management.
8P Fishbone Diagram
Covers Product, Price, Place, Promotion, People, Process, Physical Evidence, and Performance. Suitable for marketing, product development, service industries, and business management.
Practical Applications and Examples
Fishbone Diagrams are versatile tools that can be effectively applied across various industries and scenarios.
Supplier Management (4S)
In supplier management, Fishbone Diagrams help identify supply chain disruptions. Analyzing factors like supplier reliability, delivery schedules, material quality, and communication channels allows businesses to mitigate risks, improve relationships, and ensure a steady supply of quality materials.
Manufacturing Industry (6M)
In manufacturing, Fishbone Diagrams are often used to identify the root causes of production defects and stress the effects of certain events/factors. By analyzing factors such as machine settings, material quality, workforce training, and environmental conditions, manufacturers can pinpoint and address the sources of defects, leading to improved product quality and reduced waste.
Marketing Industry (8P)
Fishbone Diagrams are valuable in marketing to analyze poor campaign performance or declining sales. By examining product features, pricing, promotions, distribution, and customer feedback, marketers can identify weaknesses and opportunities, leading to more effective strategies and improved sales.

By utilizing Fishbone Diagrams in these and other scenarios, organizations can systematically identify and address the root causes of problems, leading to more effective solutions and continuous improvement.
How to Create a Fishbone Diagram in Xmind
Creating a Fishbone Diagram in Xmind is straightforward:
Step 1: Draw the Fishbone Structure
Enter Xmind and choose the Fishbone structure in the Formate panel.
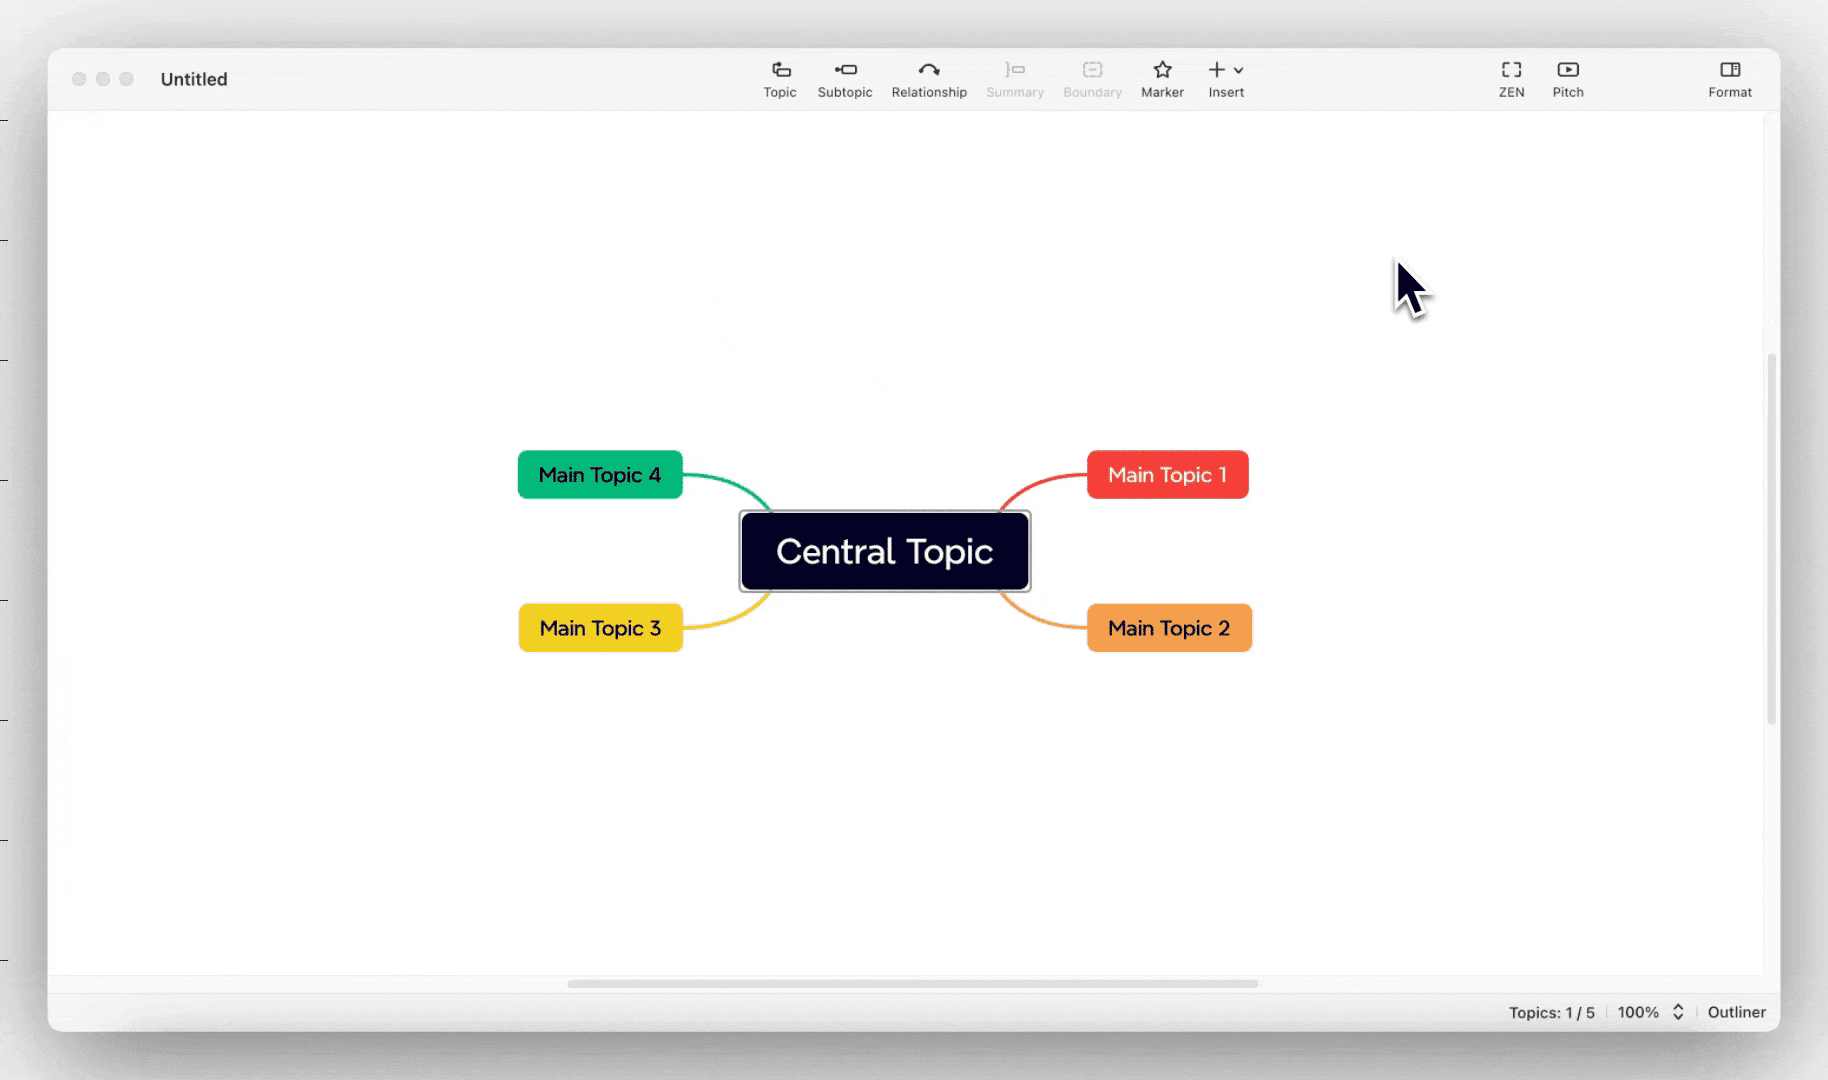
Step 2: Define the Problem Statement
Clearly articulate the problem you want to analyze in the Central Topic.
Step 3: Identify Main Categories of Causes
Set up the appropriate categories (People, Processes, Equipment, etc.) relevant to your problem in the Main Topics.
Step 4: Brainstorm Possible Causes
Within each category, brainstorm and list potential causes by extending the corresponding Subtopics.
Step 5: Populate the Diagram
Fill in the diagram with not only the identified causes that ensure clarity and logical flow but also multimedia resources to enrich your analysis.

Fishbone Diagram vs. Timeline Charts
Fishbone Diagrams and Timeline Charts are both supported structures in Xmind, each serving distinct purposes.
Fishbone Diagrams identify and categorize root causes of problems, resembling a fish skeleton, and are used for root cause analysis and problem-solving.
Timeline Charts, on the other hand, visualize the sequence and timing of events or tasks over time, aiding in project management and planning.
While Fishbone Diagrams focus on identifying the causes of specific problems, Timeline Charts are ideal for tracking and planning the chronological sequence of events. Both tools are valuable in Xmind, catering to different aspects of analysis and planning.

Fishbone Diagrams are invaluable tools for root cause analysis and problem-solving. Using Xmind to create these diagrams enhances their effectiveness through a user-friendly interface, customizable templates, and integration with other mind-mapping features. By understanding the components, types, and practical applications of Fishbone Diagrams, teams can improve their problem-solving efficiency and achieve better outcomes.


