


Gantt Chart
Switch seamlessly between your mind map and the Gantt chart. All changes stay synced across both views.

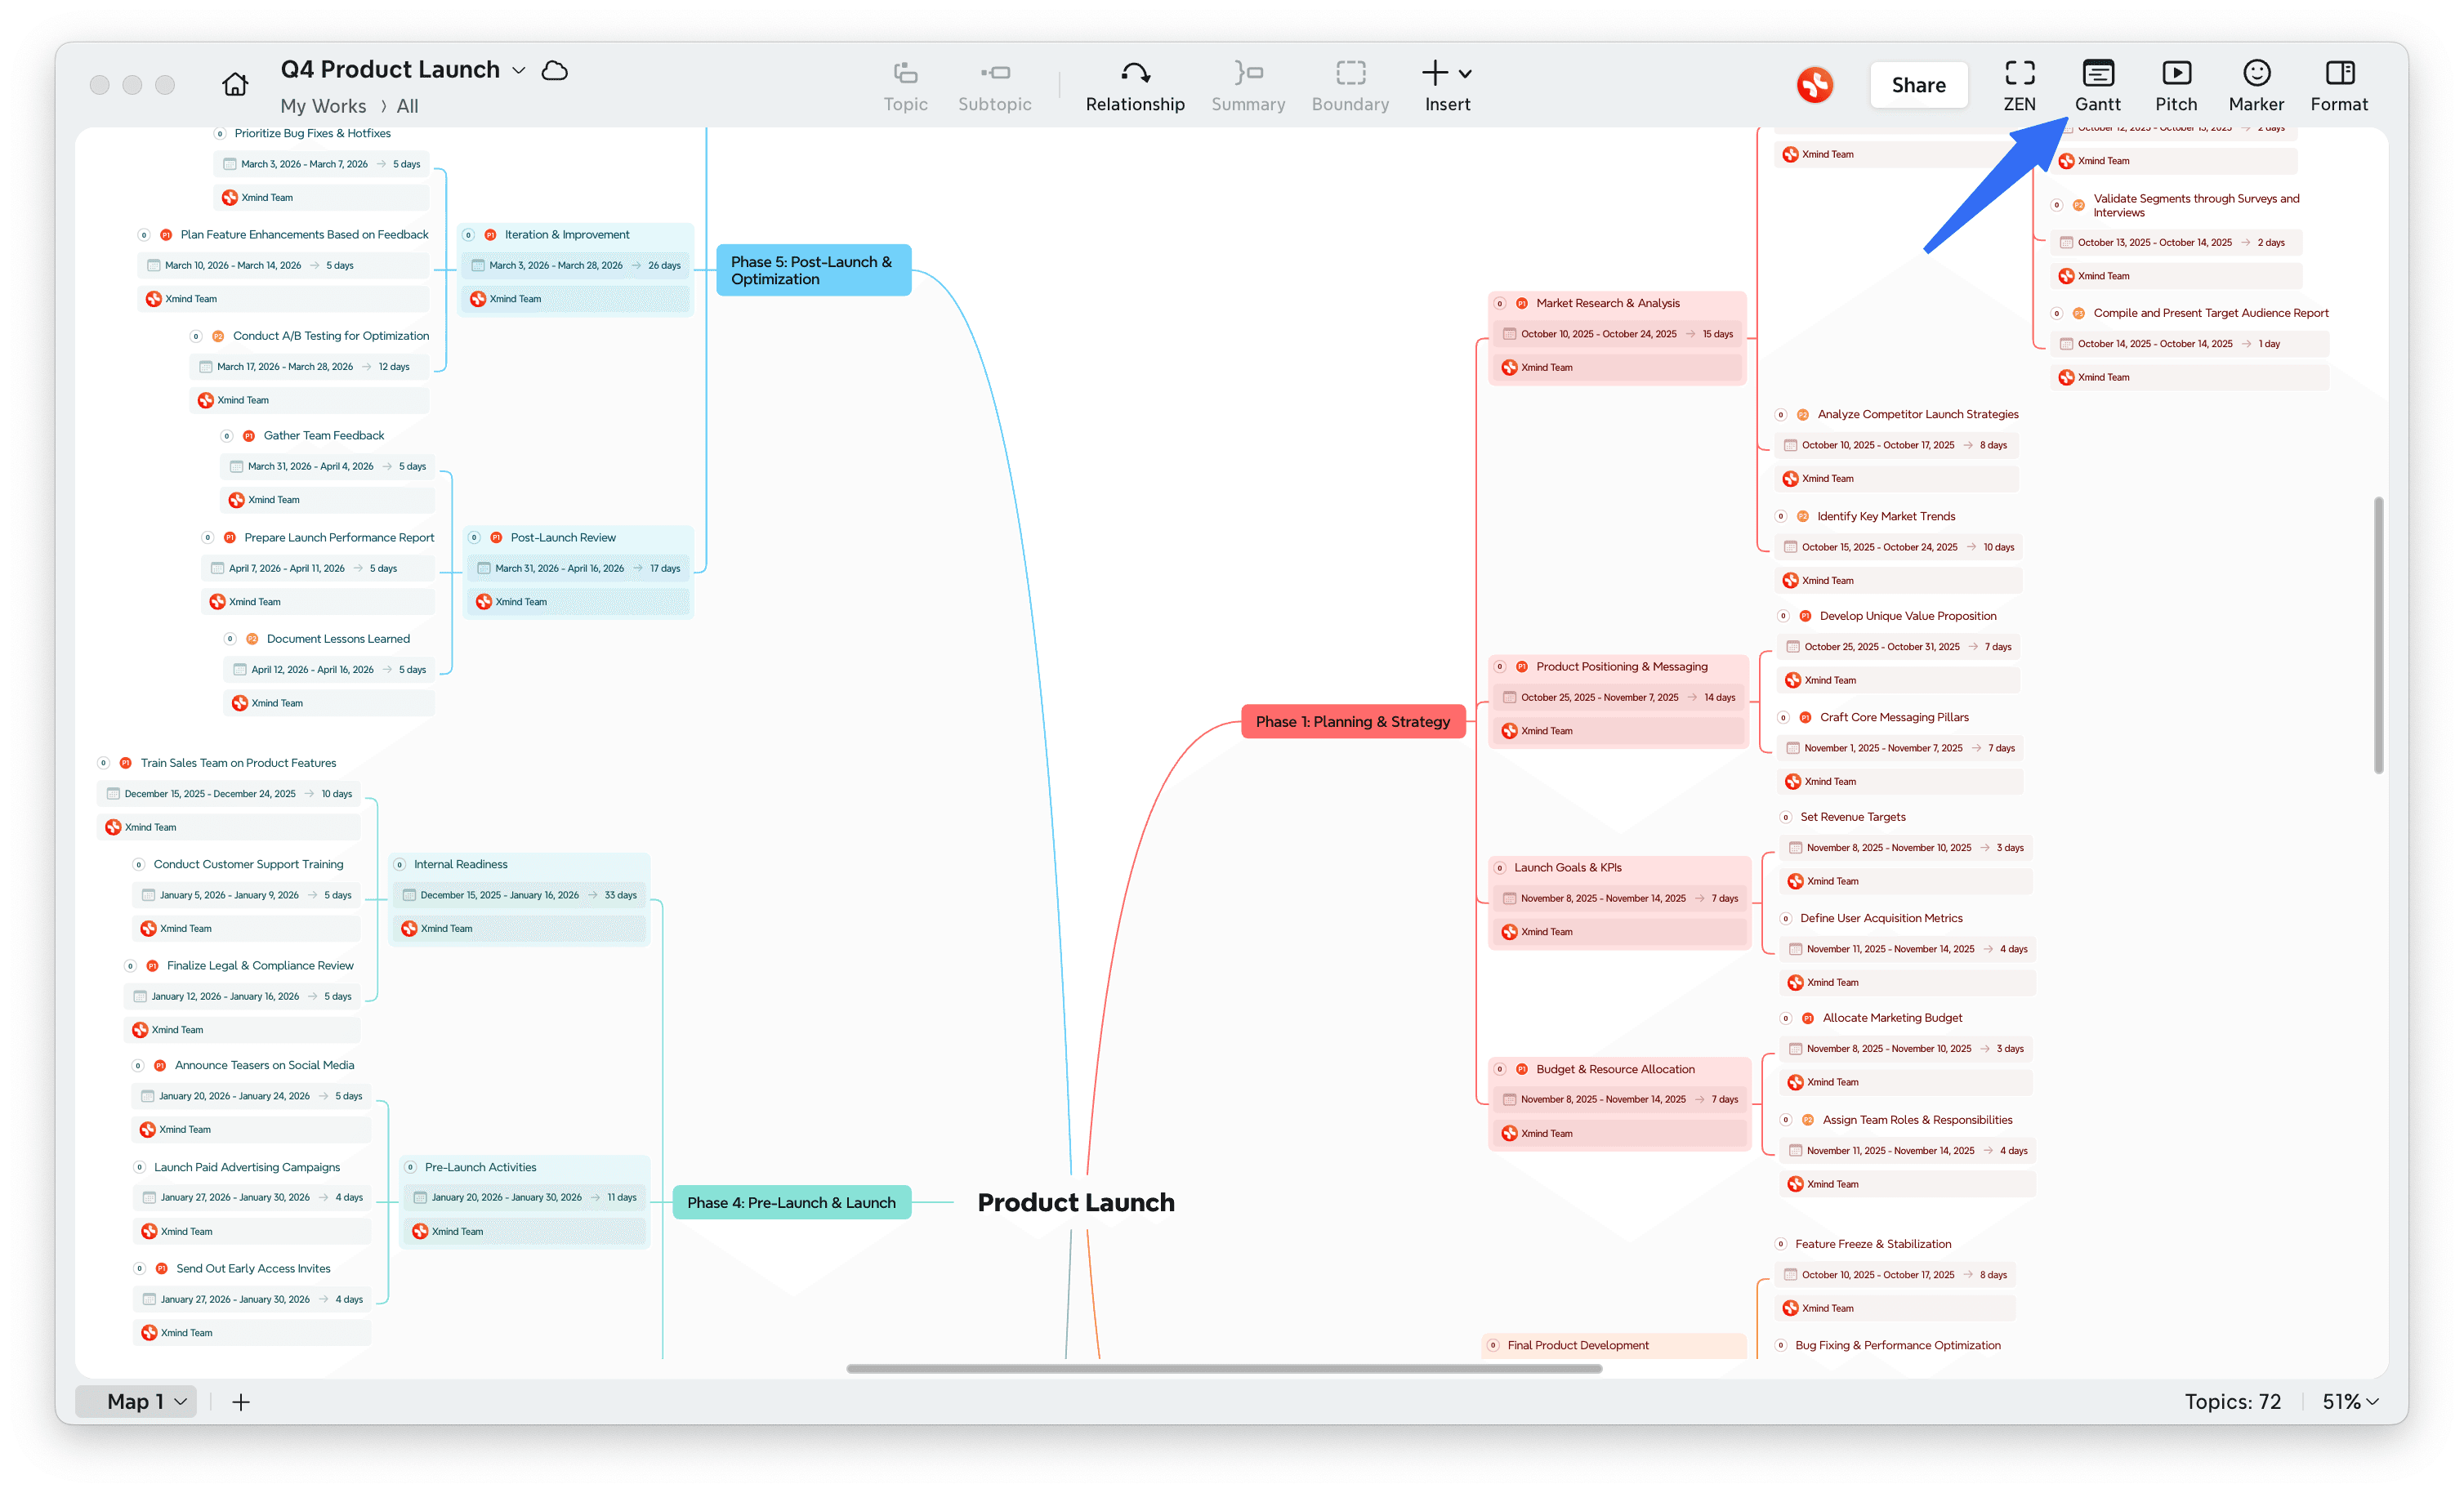
Switch to Gantt chart view in Xmind
On desktop app
After planning your tasks in a mind map, click the Gantt icon on the toolbar, or go to View > Gantt Chart to open the Gantt view.
In the Gantt view, drag the time bar to adjust task duration. Dependent tasks update automatically—no manual changes needed.
Drag the progress bar directly on the task bar to mark progress.
Click any task to edit its details directly in the left panel. All updates sync instantly with your mind map.

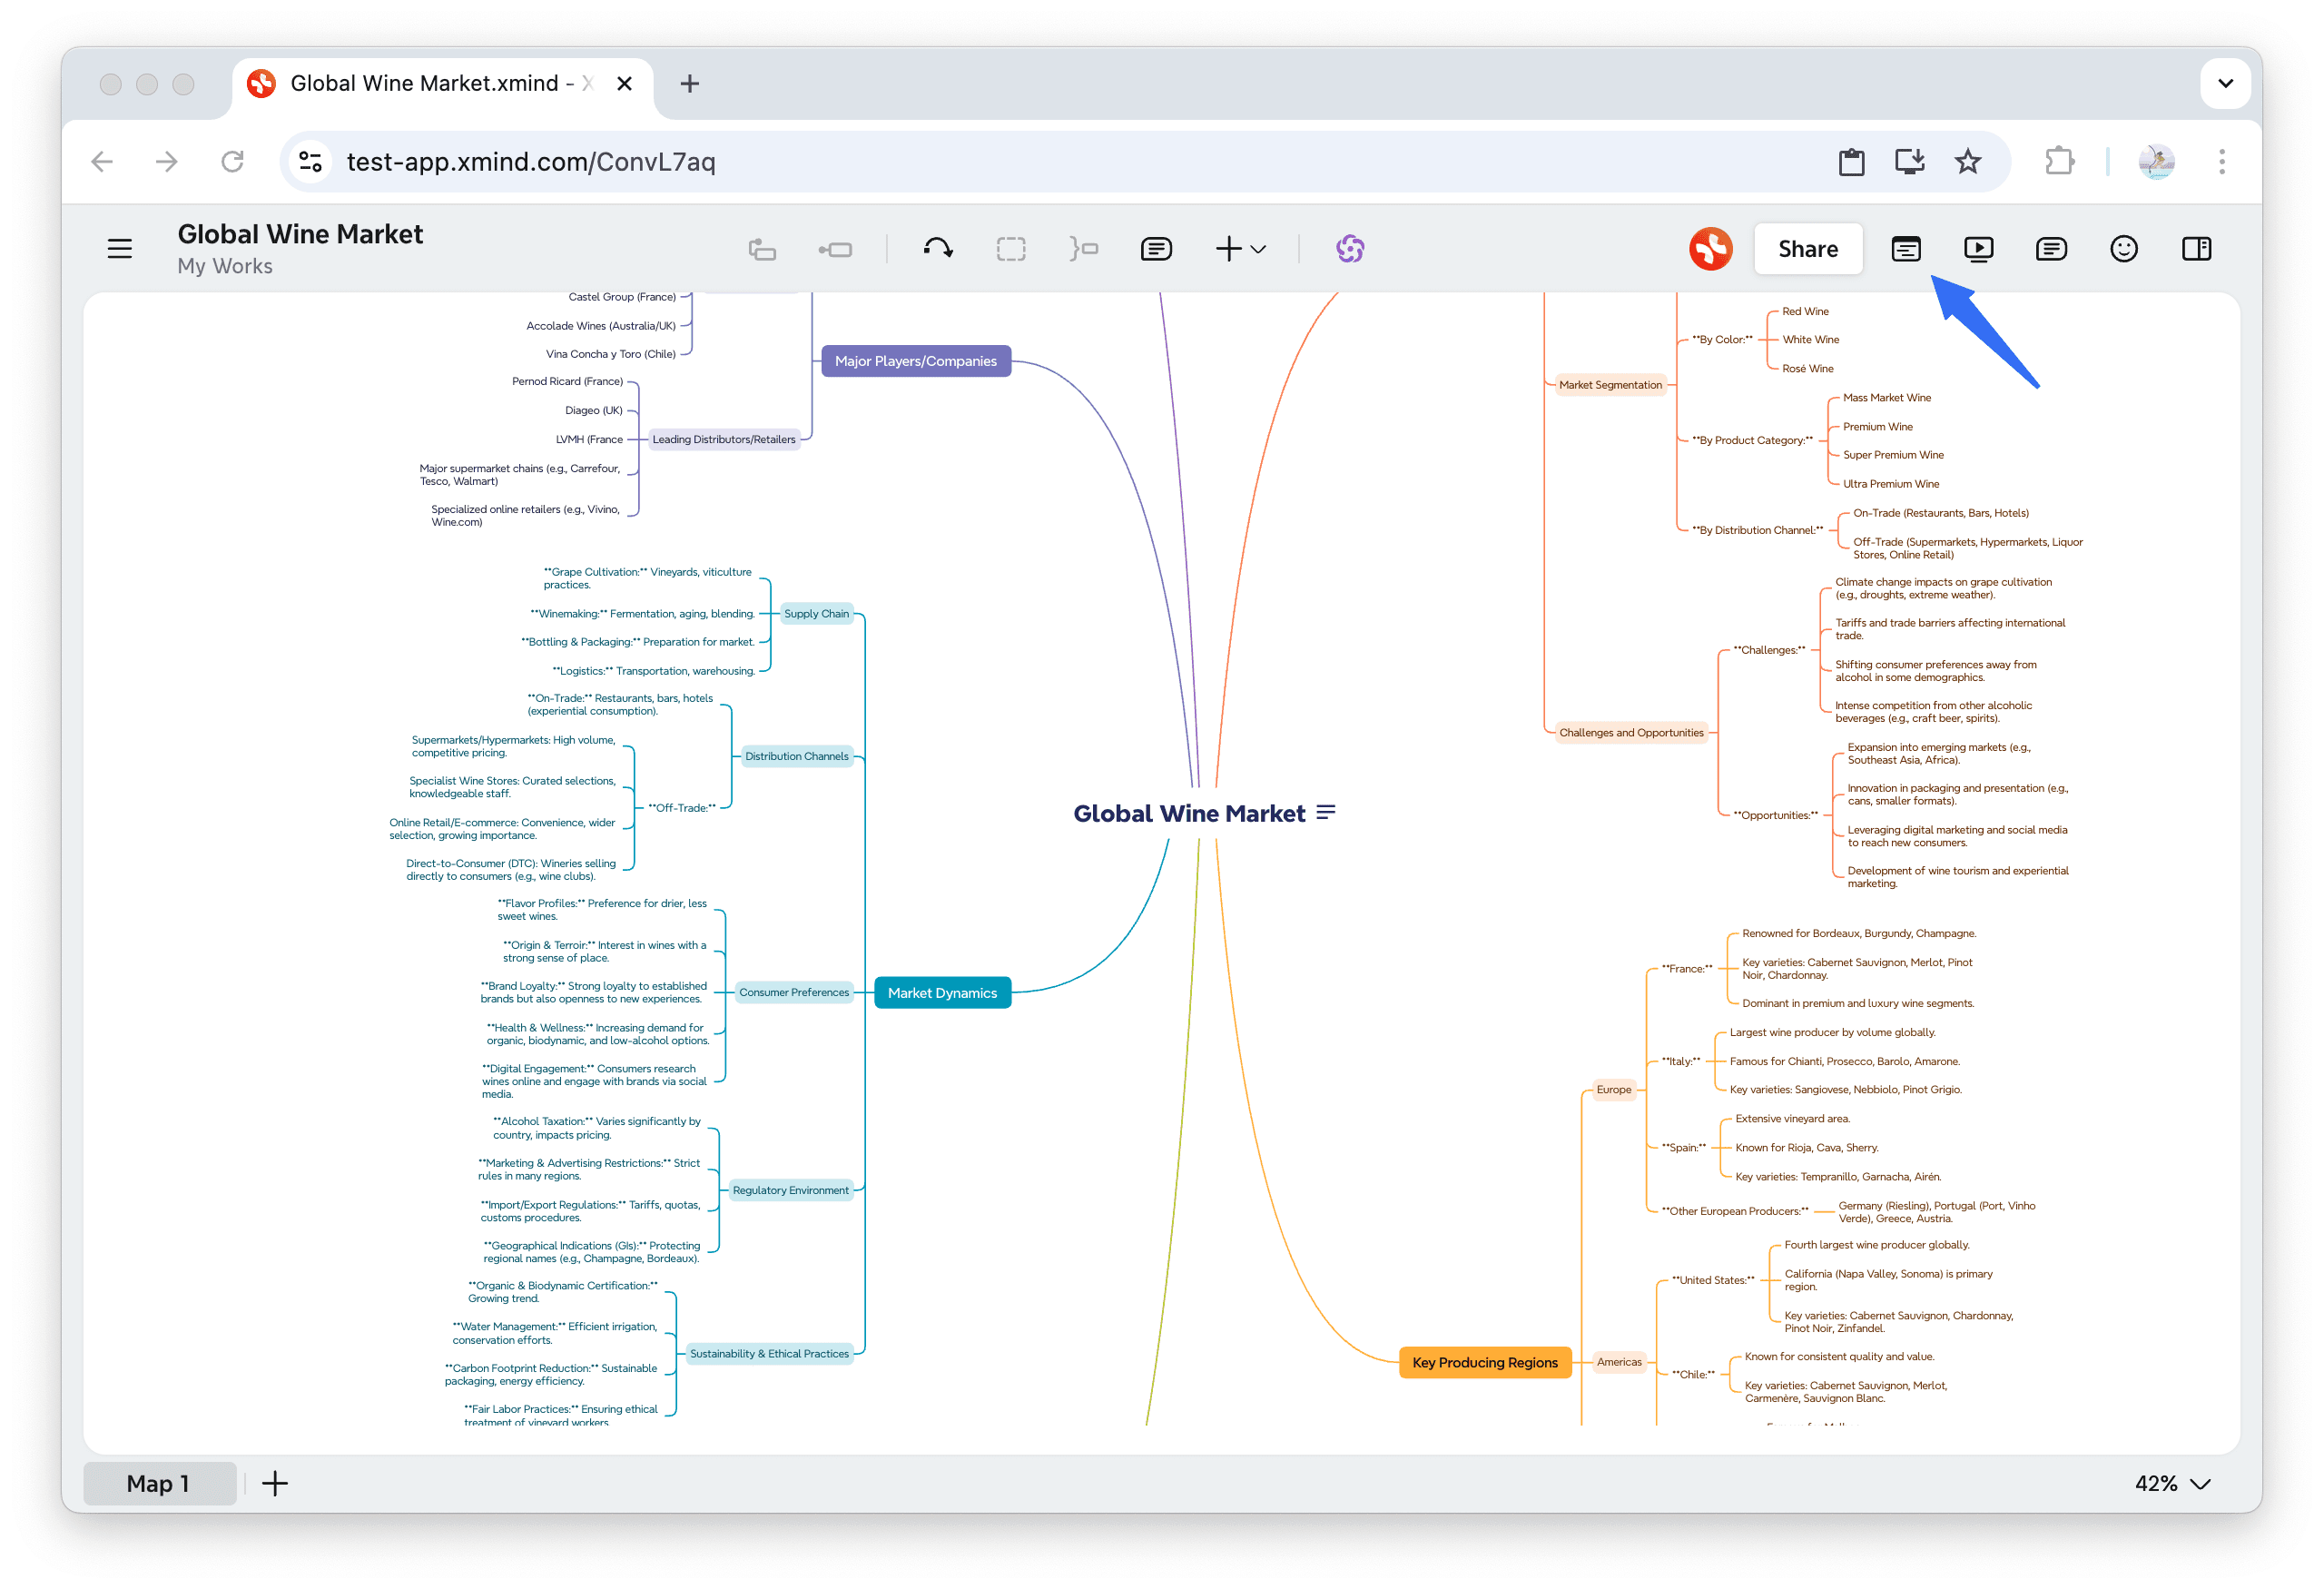
On web
Click the Gantt icon on the toolbar to open the Gantt view, and all tasks will appear in a timeline pop-up.
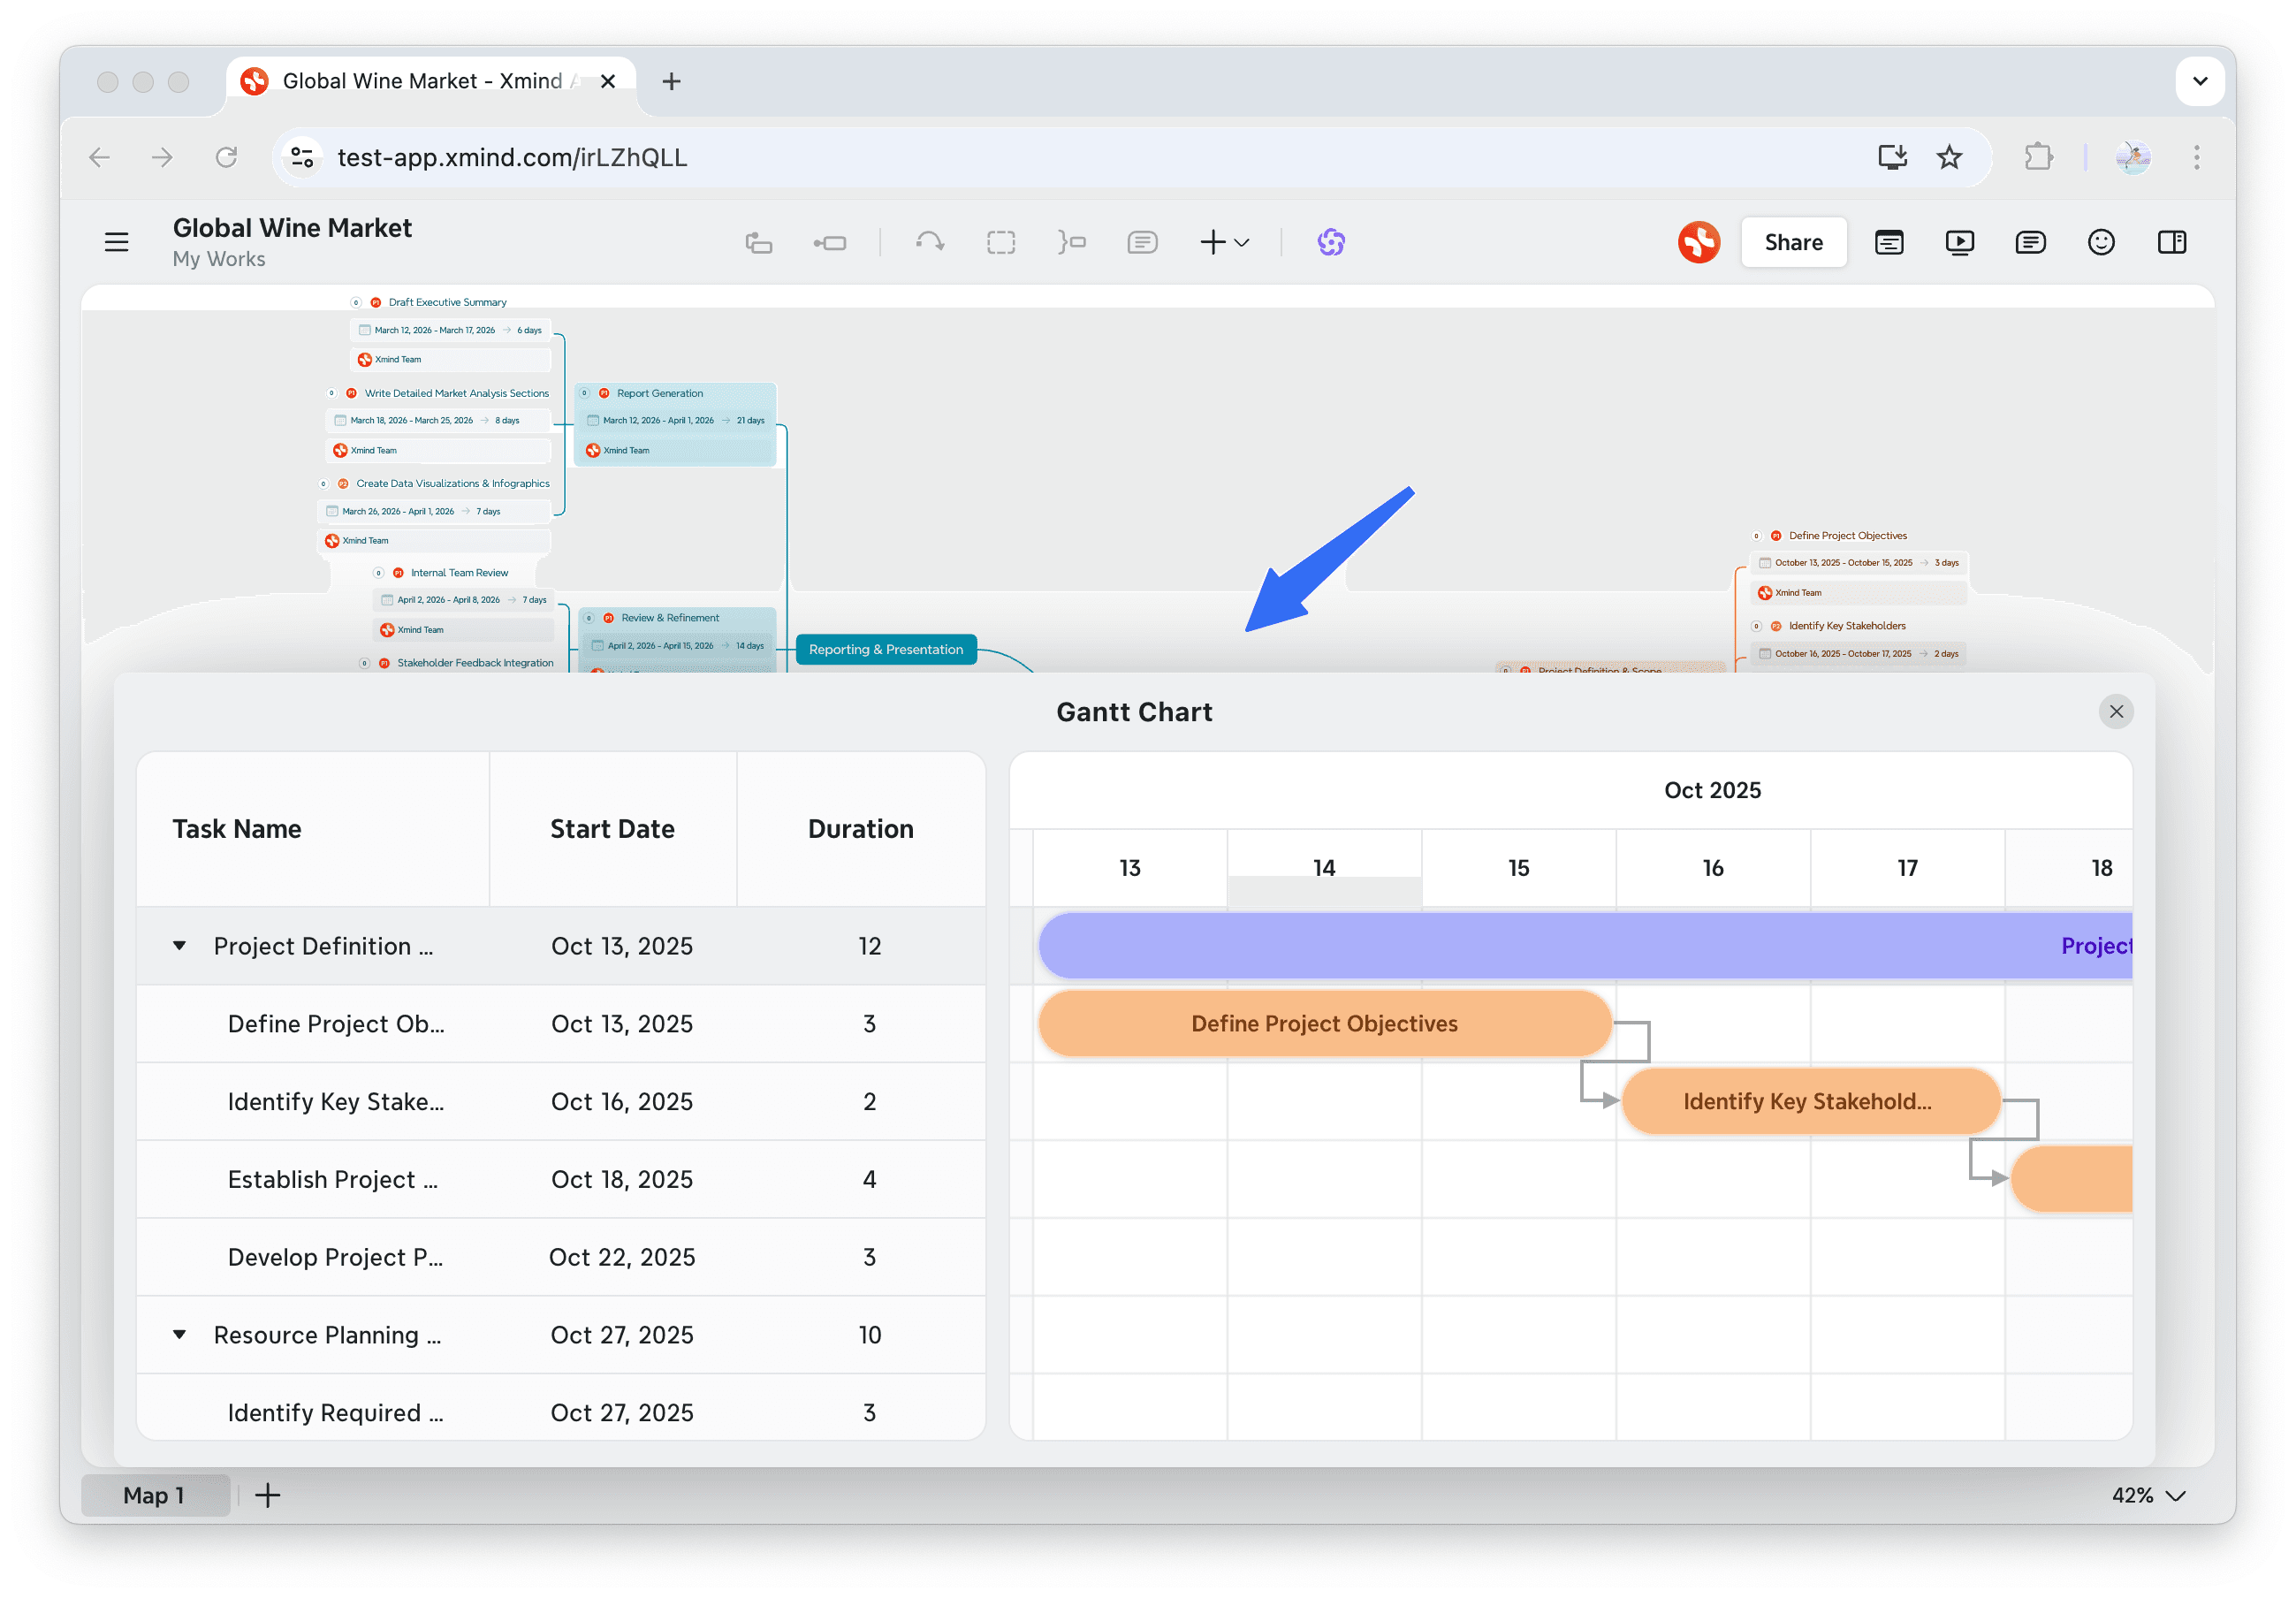
Other actions, such as adjusting the time bar, dragging the progress bar, or editing task details, work the same as in the Desktop version.
💡 Tip: Zoom in or out in Gantt view on either desktop or web to get a clearer overview of your project timeline.
Create Dependencies Between Tasks
1️⃣ Set task durations
2️⃣ Specify a start/end date for at least one task.
2️⃣ Open the Gantt Chart
3️⃣ Select tasks (hold Shift)
4️⃣ Click Dependencies in the toolbar.
Xmind creates task dependencies based on the order you select and calculates start and end dates automatically.

Export & Print Your Gantt Chart
Export Gantt Chart
1️⃣ In the Gantt Chart view, go to Toolbar > Export
2️⃣ Choose your preferred format: PNG, JPEG, PDF, Excel, or Calendar.

Xmind exports all tasks visible in the current view, covering the full project timeline.
Print Gantt Chart
1️⃣ In the Gantt Chart view, go to Toolbar > Print
2️⃣ Adjust the print settings as needed:
Printer
Copies
Layout
Page Size
Scale
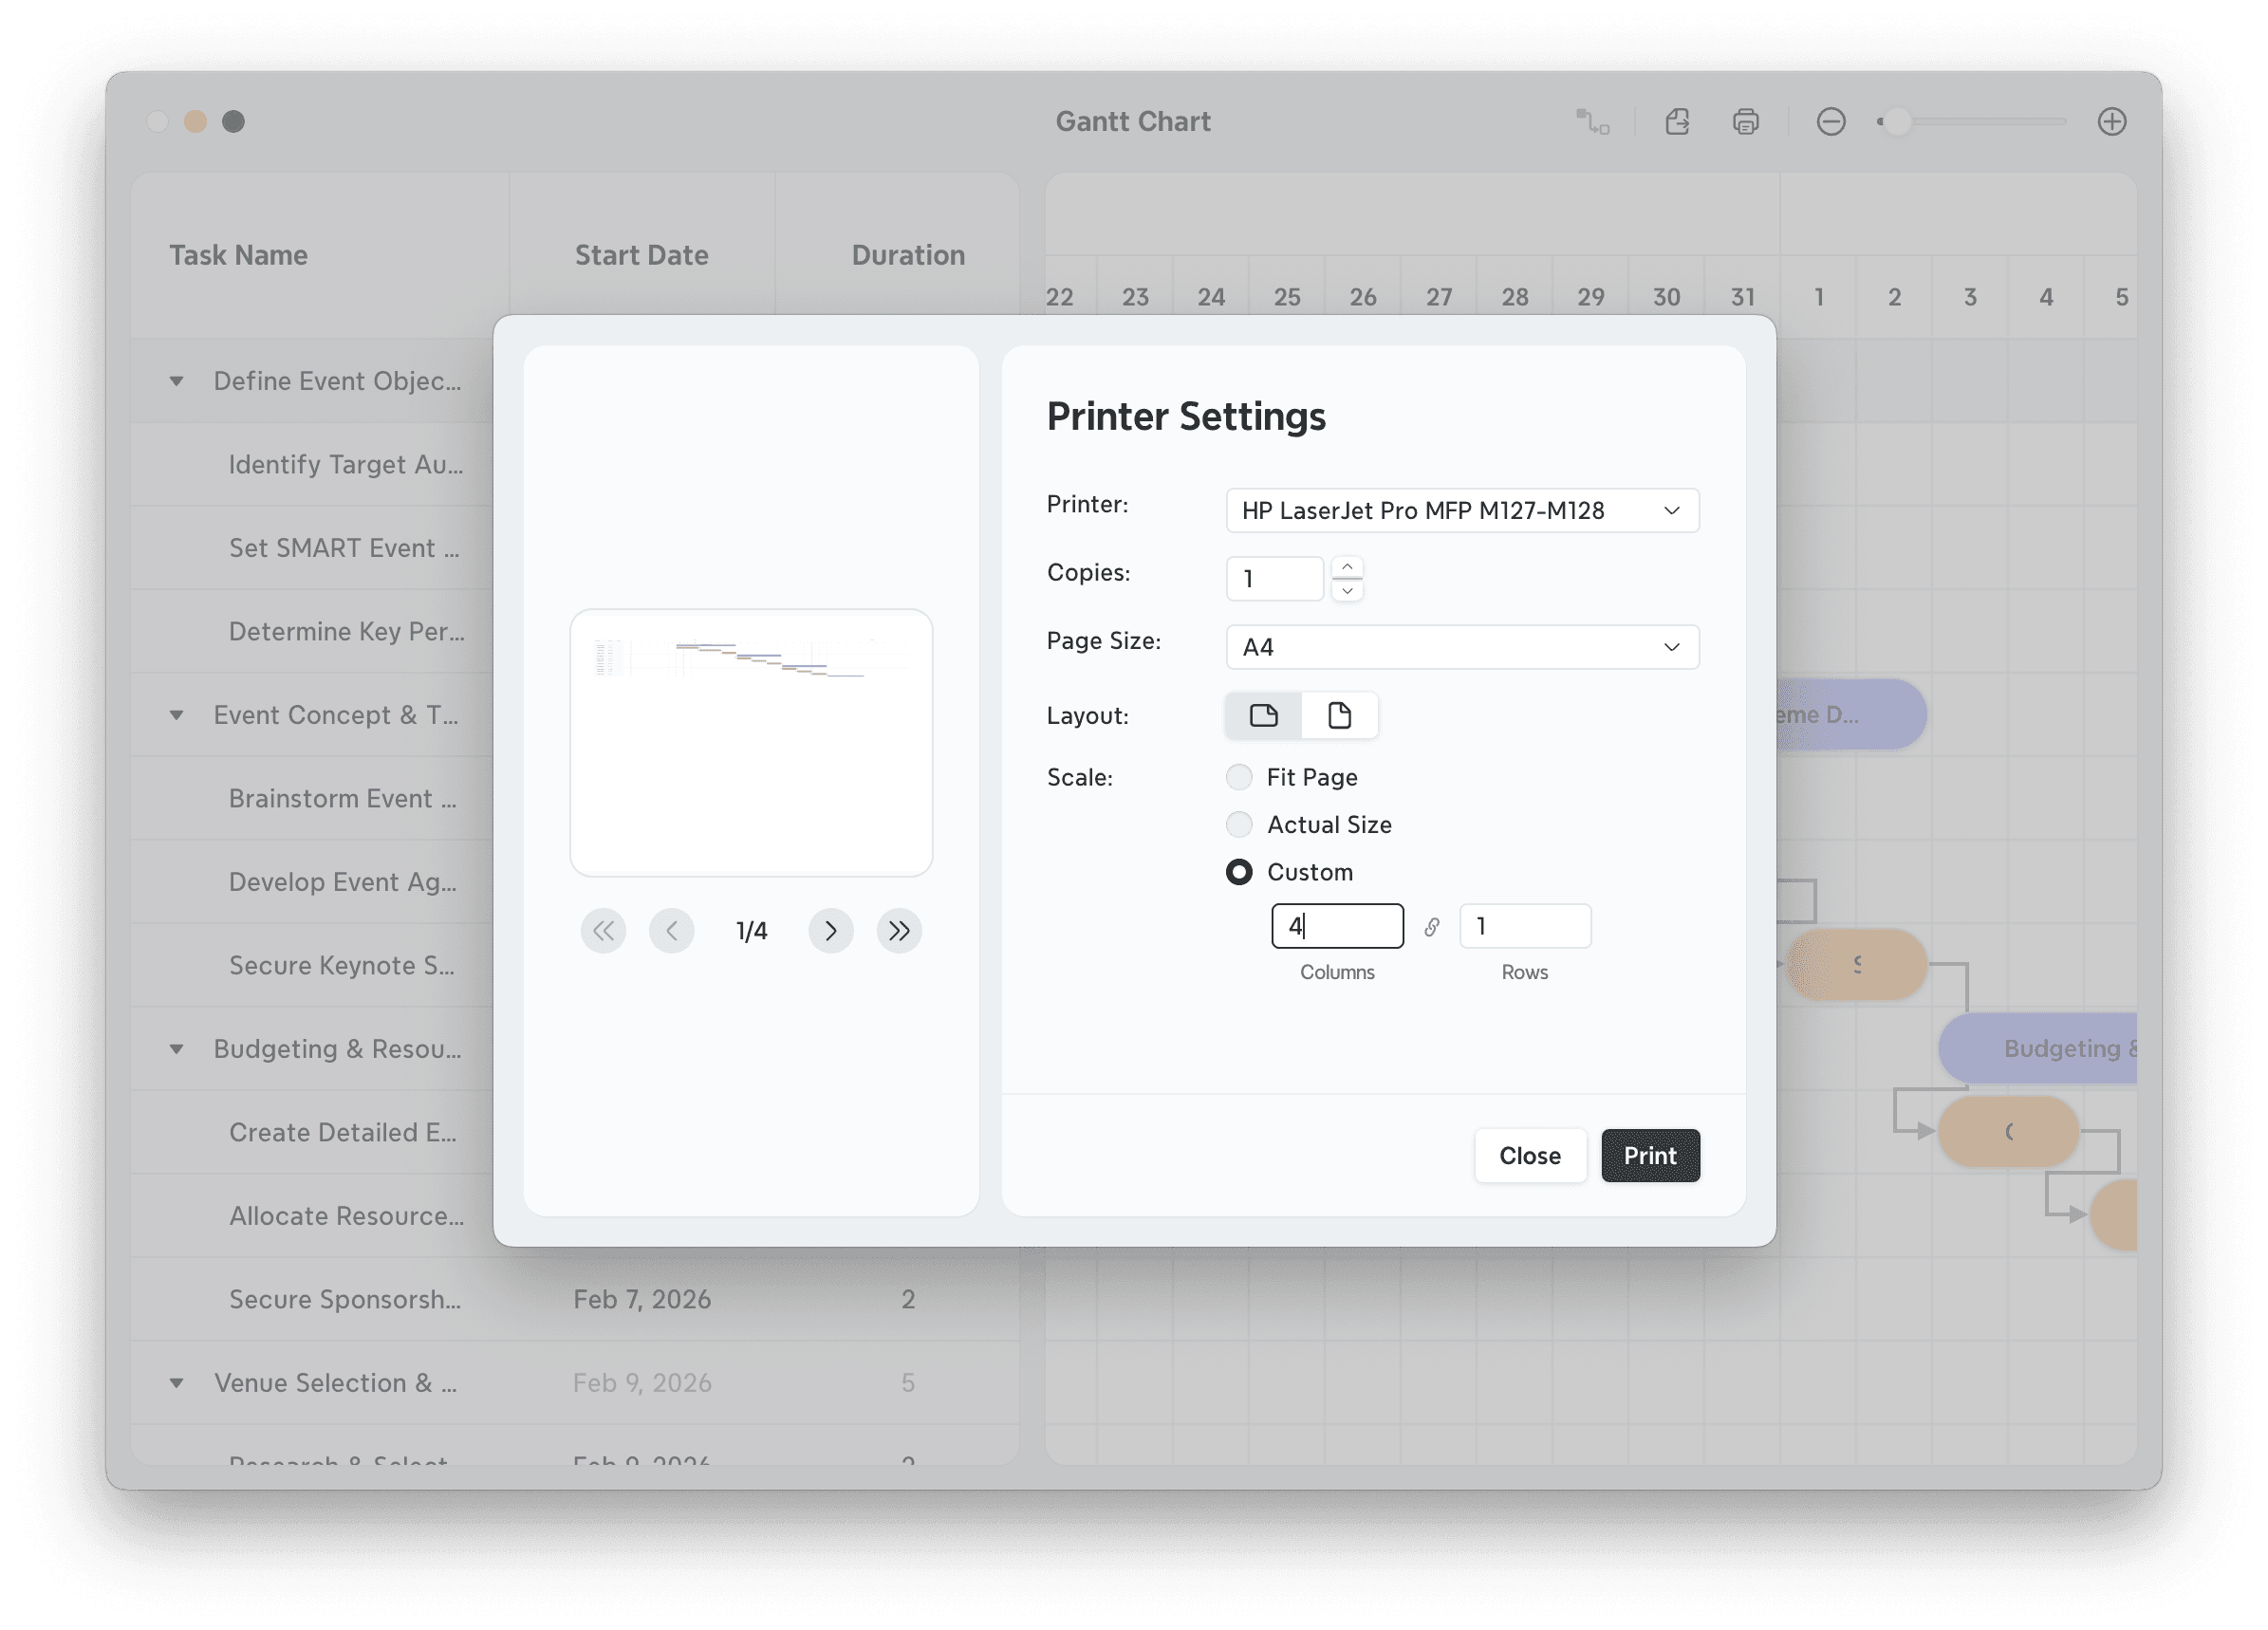
You can divide the Gantt Chart across multiple pages by customizing columns or rows. Xmind automatically preserves the aspect ratio and minimizes page usage.


